
By Christian Tottrup, Daniel Druce, Gyde Kruger, Puzhao Zhang, Cécile Kittel and Torsten Bondo
The Global Wetland Watch (GWW) is aiming to fill a critical global data gap by developing and providing a new global-level inventory of wetlands with unprecedented spatial and thematic details.
This new wetland information will be generated using Artificial Intelligence (AI) and satellite data to create high-resolution maps and statistics on the extent and changes to different wetland ecosystems across the entire globe. The GWW has been made possible by the increasing availability of free and open high-quality remote sensing data streams and advancements in machine learning/AI and big data analytics.
The GWW mapping solution relies primarily on time-series satellite data from Sentinel-1 and Sentinel-2, offering a 10-meter spatial resolution. This data is further enhanced with additional satellite sources like Landsat, ALOS PALSAR, and satellite-derived topographic information. The GWW uses time series analysis to capture salient points of the inundation regime and the vegetation phenology. The time series information is then utilized as predictor variables in mapping wetland typologies through a combined mechanistic and machine learning/AI classification approach. On a global level this is a massive computational task made possible using Google Earth Engine (GEE) – a cloud platform that provides the necessary combination of large-scale computing resources with instant access to planetary scale archives of all the required input satellite imagery.
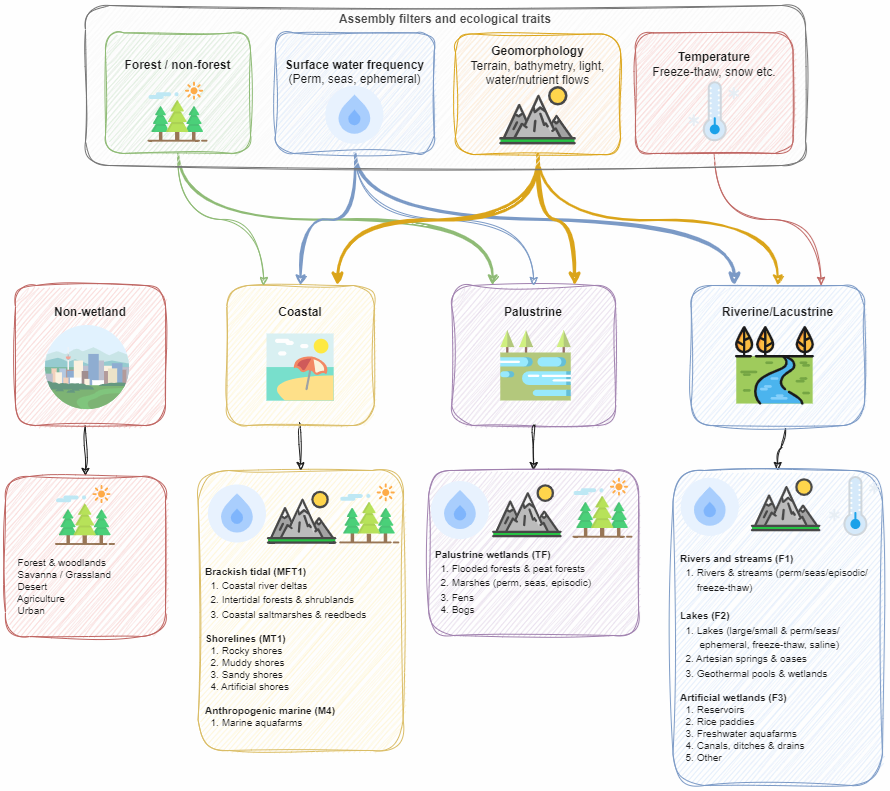
Given the world’s diversity, a one-size-fits-all approach isn’t feasible, so different classification models are being tailored for different continents, biomes, ecoregions, and wetland categories. Within this classification hierarchy, a key distinction is made between coastal, inland and human made wetlands, with further subdivision of wetland types according to the IUCN Global Ecosystem Typology classification.
Stratification / classification framework
In recent months, we have prototyped this mapping solution (see examples in Box 1), and it is now being rolled out and demonstrated across the entire national territories of Colombia, South Africa, Uganda and Australia. In the coming months we will evaluate the outcomes with the national stakeholders to ensure the new information meets national needs and supports actionable initiatives.
Additionally, we will introduce and discuss a new interactive feature called “Human-in-the-Loop,” which will enable users to provide feedback and add new labels to help retrain the underlying classification model and thereby continuously enhance the timeliness and quality of the information provided by GWW.
Over time, all these efforts will converge to create a comprehensive end-to-end system for global wetland mapping and monitoring. The availability of the system will help address urgent country needs by enabling substantive and localized on the ground activities for wetland conservation and restoration.
An example of this is Colombia one of the world’s “megadiverse” countries, home to around 10% of the world’s species. This incredible biodiversity is closely linked to the country’s diverse ecosystems, among which wetlands play a crucial role. Yet, Colombia is currently lacking a comprehensive national inventory of wetlands. Existing efforts to inventory wetlands are regional and rely on varied methodologies. A national wetland inventory created with standardized methodologies will offers crucial data supporting national efforts in wetland management, including the development of maps for ecological integrity, identification of potential wetland restoration or conservation areas, and for monitoring of ongoing wetland restoration efforts. The GWW will also be important information source for Colombia’s contribution to reports and meetings under international conventions focusing on topics such as Ramsar, Climate Change, Cities, Restoration Goals, and Conservation, among others.
Another ongoing example is in the Lac Télé-Lac Tumba (Congo Basin) the world’s largest swamp-forest, known for its extraordinary biodiversity and providing livelihood to around 2 million people. The carbon stored in these peatlands is equivalent of three years’ worth of global fossil fuel emissions, with its swamps locking in around 30 billion tons of carbon; this makes the region one of the most carbon-rich ecosystems. Yet protection of this important freshwater wetland is urgently needed, due to contrasting interests from deforestation, expansion of oil palm and rubber plantations, and unplanned and unsustainable agricultural practices. With projects like UNEP’s IKI Congo project efforts are underway to protect these peatlands.
GWW aims to provide information to similar national and intergovernmental programs to make sure impacts happen on the ground. Furthermore, the system will be designed to help countries track their progress toward the targets set within the Sustainable Development Goals framework and the global conventions on Biological Diversity and Climate Change.